We use cookies, including cookies from third parties, to enhance your user experience and the effectiveness of our marketing activities. These cookies are performance, analytics and advertising cookies, please see our Privacy and Cookie policy for further information. If you agree to all of our cookies select “Accept all” or select “Cookie Settings” to see which cookies we use and choose which ones you would like to accept.
Financial information
With our storing competitive edge, we continue to achieve outstanding results in all business areas.
Financial highlights
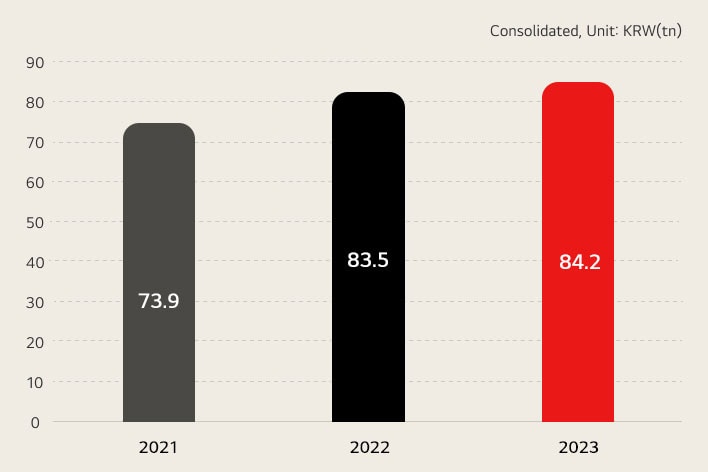
Sales
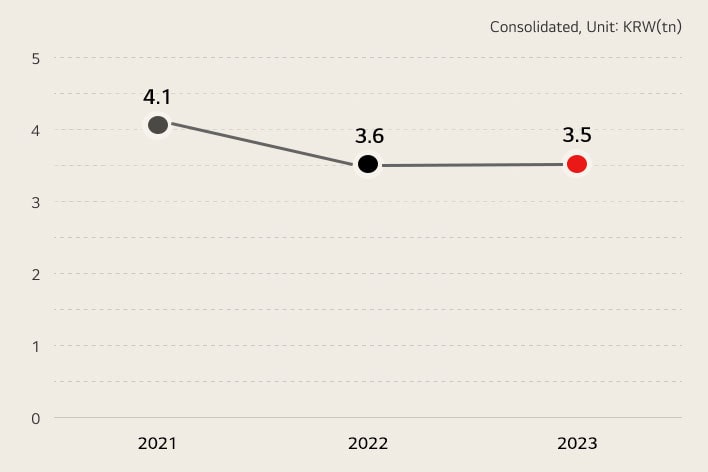
Operating profit
| Financial highlights | 2021 | 2022 | 2023 |
|---|---|---|---|
| Sales | 73,908 | 83,467 | 84,228 |
| Operating profit(loss) | 4,058 | 3,551 | 1,151 |
| Net profit(loss) | 1,415 | 1,863 | 1,151 |
| Total assets | 53,482 | 55,156 | 60,241 |
| Total liabilities | 33,338 | 32,664 | 36,742 |
| Total shareholder equity | 20,098 | 22,492 | 23,499 |
Consolidated, Unit: KRW(bn)
Statement of financial position
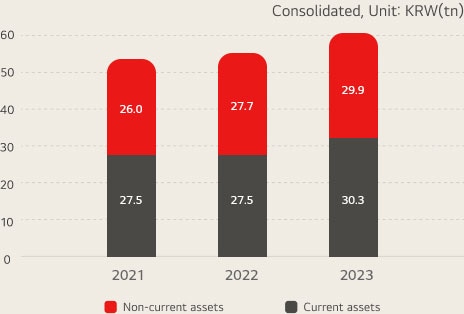
Current/Non-current assets
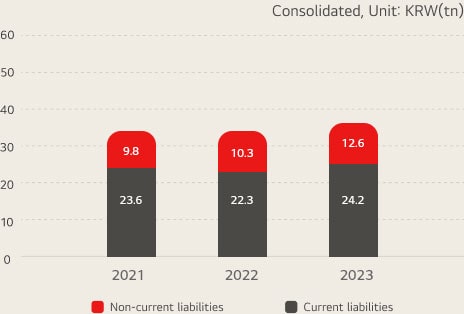
Current/Non-current liabilities
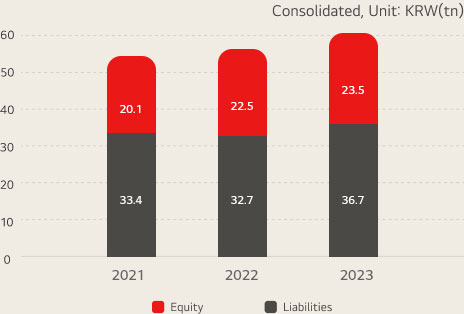
Liabilities/Equity
| Statement of financial position | 2021 | 2022 | 2023 |
|---|---|---|---|
| Assets | 53,481 | 55,156 | 60,241 |
| - Current assets | 27,488 | 27,488 | 30,341 |
| - Non-current assets | 25,994 | 27,668 | 29,900 |
| Liabilities | 33,383 | 32,664 | 36,742 |
| - Current liabilities | 23,620 | 22,333 | 24,160 |
| - Non-current liabilites | 9,764 | 10,332 | 12,582 |
| Equity | 20,098 | 22,492 | 23,499 |
Consolidated, Unit: KRW(bn)
Income statement
| Income statement | 2021 | 2022 | 2023 |
|---|---|---|---|
| Sales | 73,908 | 83,467 | 84,228 |
| Cost of goods sold | 55,011 | 63,231 | 64,425 |
| Gross profit | 18,897 | 20,236 | 19,803 |
| Operating income (loss) | 4,058 | 3,551 | 3,549 |
| Profit (loss) before income tax | 3,839 | 2,540 | 1,870 |
| Net profit (loss) | 1,415 | 1,863 | 1,151 |
Consolidated, Unit: KRW(bn)
Cash flows
| Cash flows | 2021 | 2022 | 2023 |
|---|---|---|---|
| Cash and cash equivalents at the beginning of the year | 5,896 | 6,052 | 6,322 |
| Cash flows from operating activities | 2,677 | 3,108 | 5,914 |
| Cash flows from investing activities | -2,466 | -3,228 | -5,290 |
| Cash flows from financing activities | -282 | 448 | 1,503 |
| Net increase in case and cash equivalents | 160 | 212 | 2,165 |
| Cash and cash equivalents at the end of the year | 6,052 | 6,322 | 8,488 |
Consolidated, Unit: KRW(bn)
Financial statements
-
20242023202220212020201920182017201620152014201320122011201020092008200720062005200420032002200120001999
Credit rating
Global credit rating
| Rating agency | Current rating | Last evaluation date |
|---|---|---|
| Moody’s | Baa2 (Positive) | February 2025 |
| S&P | BBB (Stable) | October 2023 |
Rating definitions of Moody’s and S&P
Moody’s has rating categories, from Aaa to C. and S&P has 10 rating categories, from AAA to D. Ratings from Aaa to Baa are considered investment-graded by Moody’s, and ratings from AAA to BBB are considered investment-graded by S&P. When rating agencies evaluate a credit rating, they also attach a “rating outlook” to each rating. “Positive” means that a rating may be raised, “Negative” means that a rating may be lowered, and “Stable” means that a rating is not likely to change.
| Classification | Moody’s | S&P | Definition |
|---|---|---|---|
| Investment grade | Aaa | AAA | Highest quality |
| Aa | AA | High quality (very strong) | |
| A | A | Upper medium grade (strong) | |
| Baa | BBB | Medium grade | |
| Non-investment grade | Ba | BB | Lower medium grade(somewhat speculative) |
| B | B | Low grade (speculative) | |
| Caa | CCC |
| |
| Ca | CC | Most speculative | |
| C | C | No Interest being paid or bankruptcy petition filed | |
| - | D | In default |
Domestic credit rating
Rating agency | Bond | |
|---|---|---|
Current rating | Last evaluation date | |
KIS | AA | June 2023 |
KR | AA | May 2023 |
NICE | AA | May 2023 |
Bond rating definitions
There are 10 rating categories for bond ratings, from AAA to D. While obligors in rating categories AAA to BBB are considered investment-graded, having more than adequate abilities to meet their financial commitments in a timely fashion, those in rating categories BB to C are believed to contain speculative characteristics in terms of their redemption stability. Obligors in category D are in default.
Rating | Definition |
|---|---|
AAA | An obligor rated 'AAA' has unquestionable capacity to redeem its financial obligations, and holds extremely low investment risks. |
AA | An obligor rated 'AA' has strong capacity to redeem its financial obligations, although its solvency is relatively weaker than the obligors in the AAA category. |
A | An obligor rated 'A' has satisfactory capacity to redeem its financial obligations, although it is somewhat more susceptible to the adverse effects of changes in its business and economic environments than the obligors in the AA rating categories. |
BBB | An obligor rated 'BBB' has moderate capacity to redeem its financial obligations, although its capacity is more likely to be weakened by the adverse effects of changes in its business and economic environments than the obligors in the A category. |
BB | An obligor rated 'BB' currently has the capacity to redeem its financial obligations. However, it's redemption stability contains speculative characteristics that it cannot be guaranteed in the long-term. |
B | An obligor rated 'B' is speculative in meeting its financial commitments. Adverse circumstantial changes are likely to impair the obligor's capacity to pay the interests. |
CCC | An obligor rated 'CCC' is highly speculative in meeting its financial commitments. |
CC | An obligor rated 'CC' is more speculative than the obligors in the CCC category. |
C | An obligor rated 'C' has a high default risk and no capacity for redemption. |
D | An obligor rated 'D' is in default. |